 communications
The World Wide Web is probably the most widespread project created in the history of humanity. With each passing year, the Internet grows exponentially. It needs cables, servers, towers and a lot of other things to work; this complicated infrastructure is being constantly updated and upgraded.
It’s almost impossible to imagine all these complicated communications — without a specialized map, of course. People all over the world have created a number of maps that visualize the Internet from different angles: the most popular web resources, locations where cables lay, interconnection of devices or domains and so on and so forth.
So strap on your explorer cap and get ready to take a look at the most interesting maps of the Internet.
1. Underwater threads of the World Wide Web
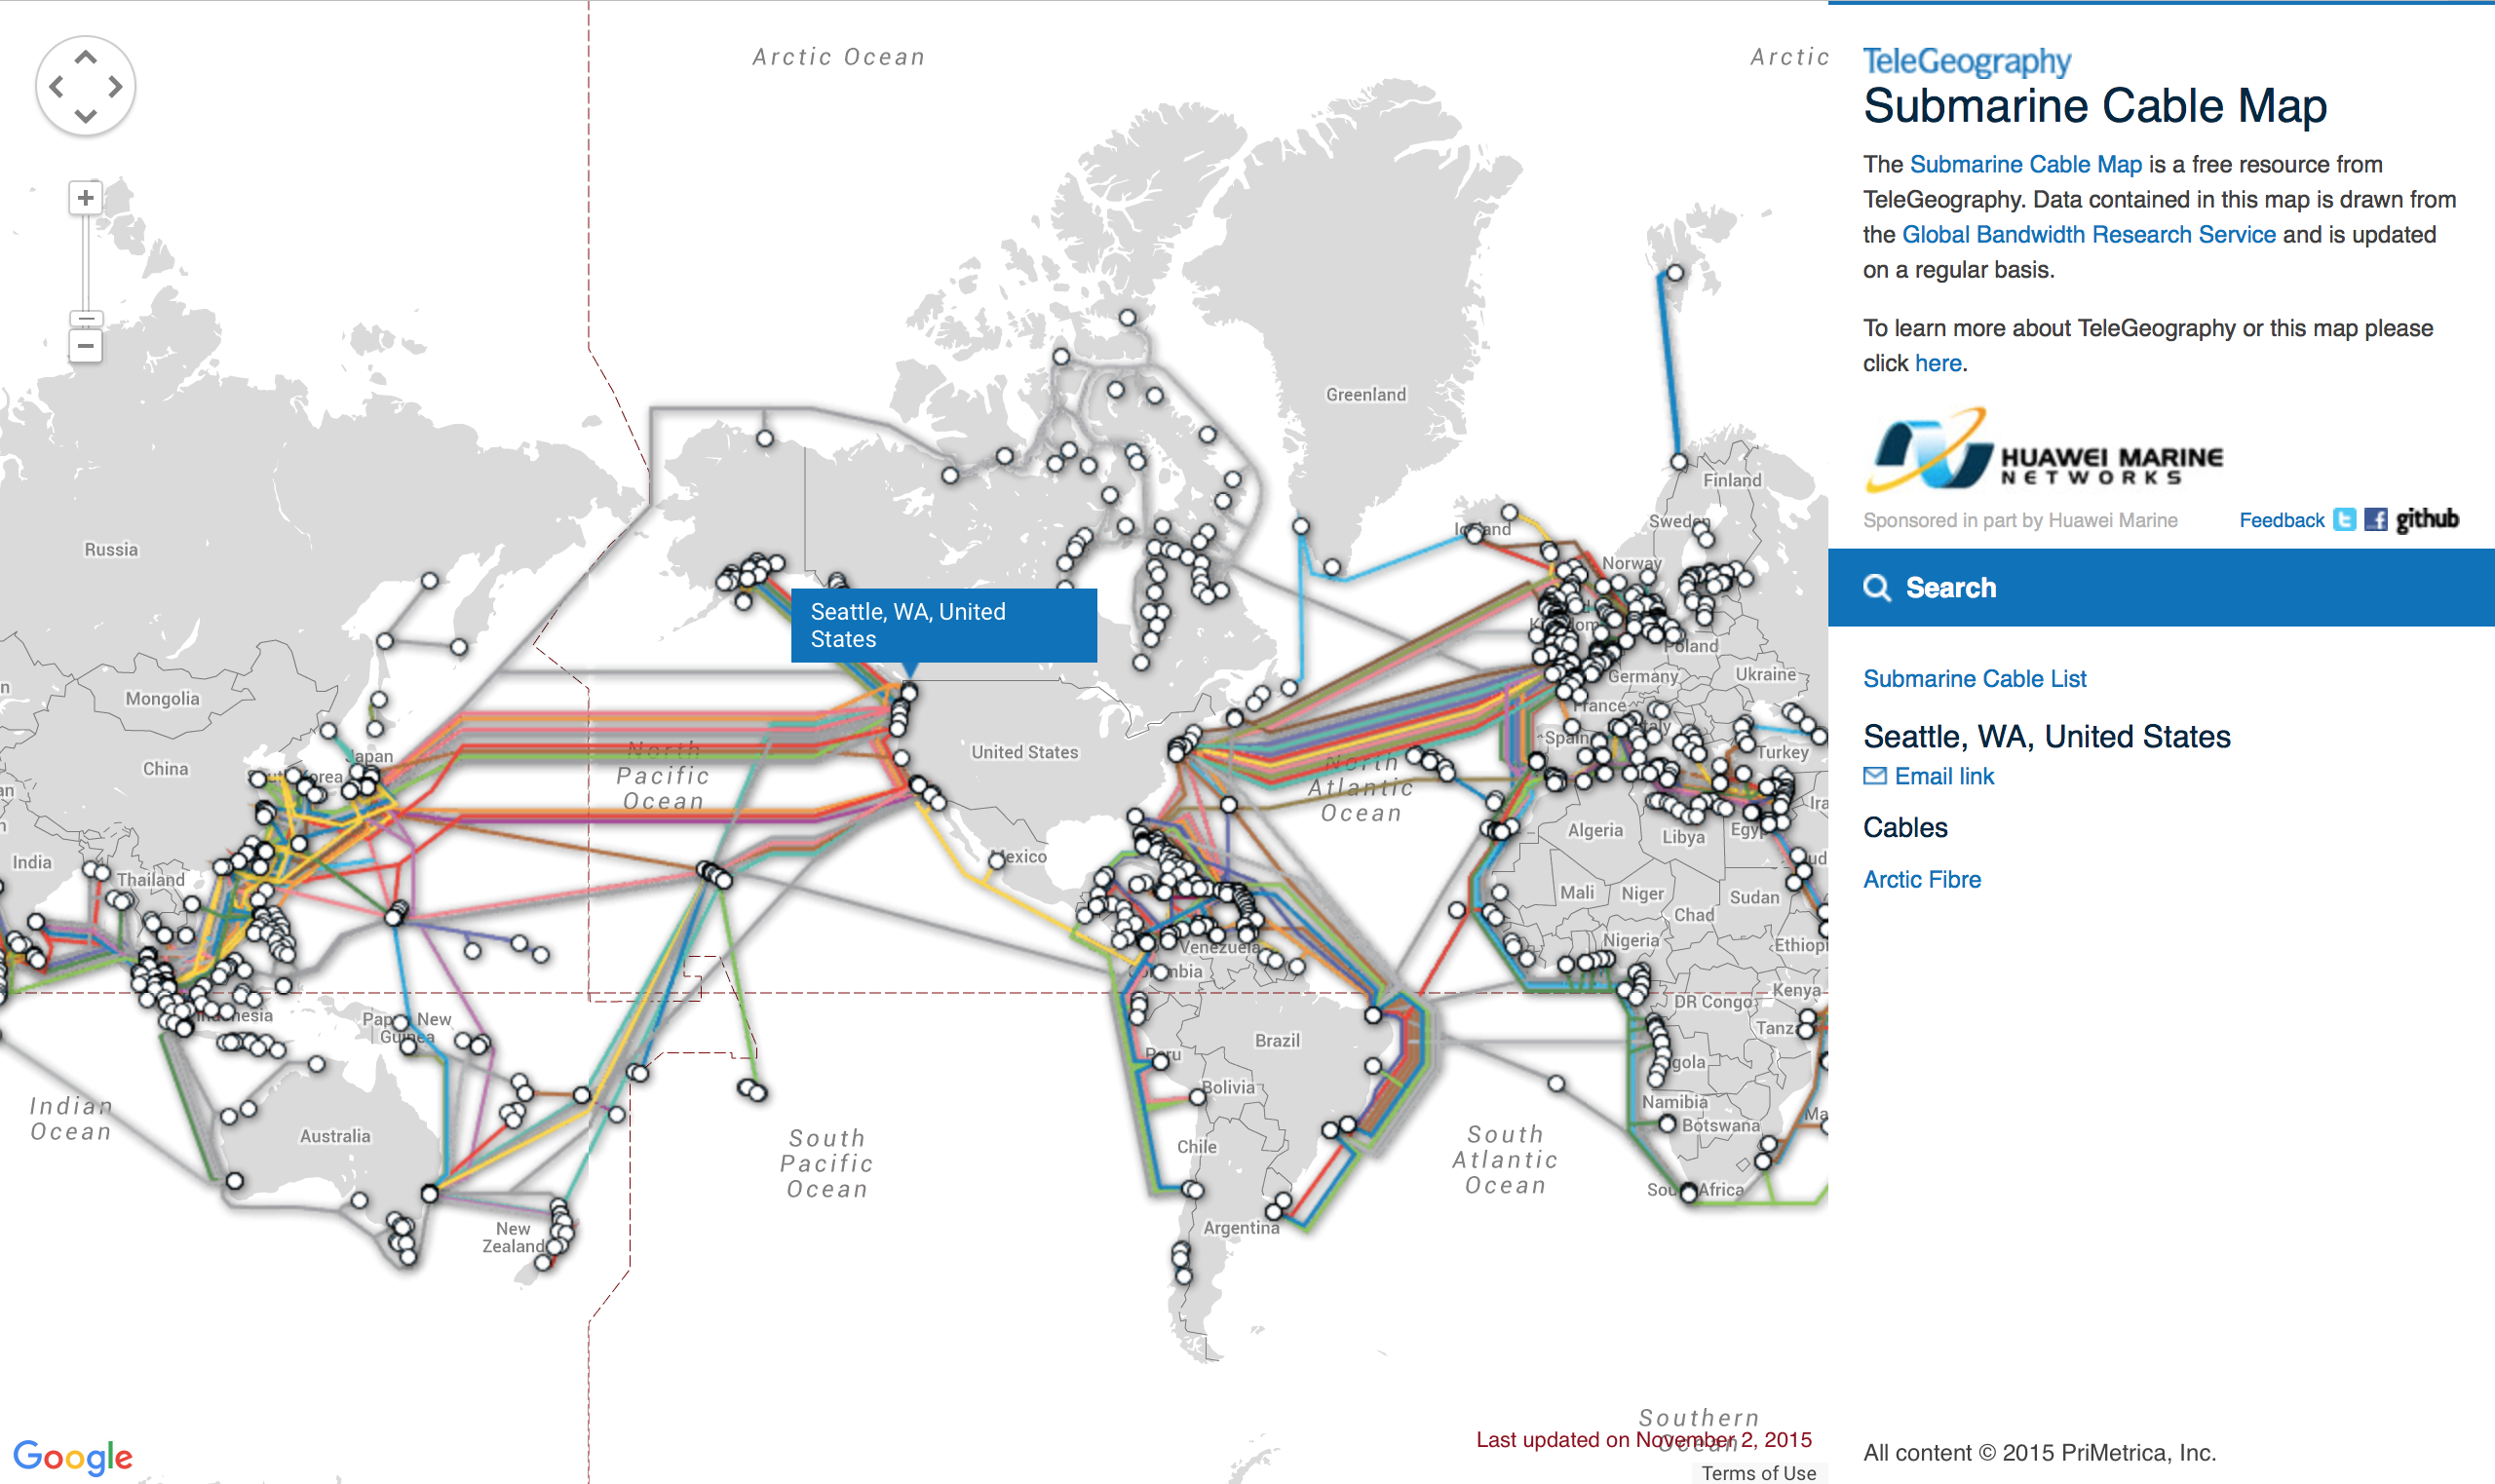
A telecom market research company TeleGeography released an interactive map of the underwater cables that connect the global Internet. The picture doesn’t show the precise routes of underwater cables — otherwise the map would be really messy — but it accurately presents the land-based taking-off points for the massive underwater series of tubes.
By clicking throughout the map, you can view a list of all cables connected to a specific country and find out when the different cables went online.
2. How many different objects we’ve sent into space?
Of course, cables transfer only a part of global data. For example, scientists in Antarctica and sailors out at sea use satellite connections.
James Yoder, first-year student from University of Texas created a 3D map, which tracks thousands of satellites, spent rockets and debris as they orbit the Earth in real time.
Satellites are marked in blue, spent rockets — with red and debris — in grey.
There are about 21,000 pieces of debris larger than 4 inches around the Earth. As you can see the space is looking quite overcrowded. The map is updated in real time using data from Space-Track.org.
3. A map of Internet brands and phenomena
Another student and amateur designer from Slovakia created an unusual map, which shows famous companies, organizations, societies and phenomena associated with the Internet. 
There are several additional maps in the margins, as well as a lot of text that tells about the most popular sites, main milestones in the history of Internet, the most influential online companies and best-selling games, etc.
4. The map of mobile Internet according to Twitter
On the image below, you see 280 million Tweets posted from mobile phones. The picture reveals, which smartphones are used in different parts of the world. The map is interactive and you can give it a try here.
Here is another interesting map that shows when and where people tweet about sunrise in different languages. 
Of course, you can write about dawn anytime. But if you compare the time when these tweets are posted and when the sun rises, you’ll understand: people mostly tweet about dawn when the day breaks. So let’s see how early birds wake up with the Twitter sunrise map!
4. The power is everywhere
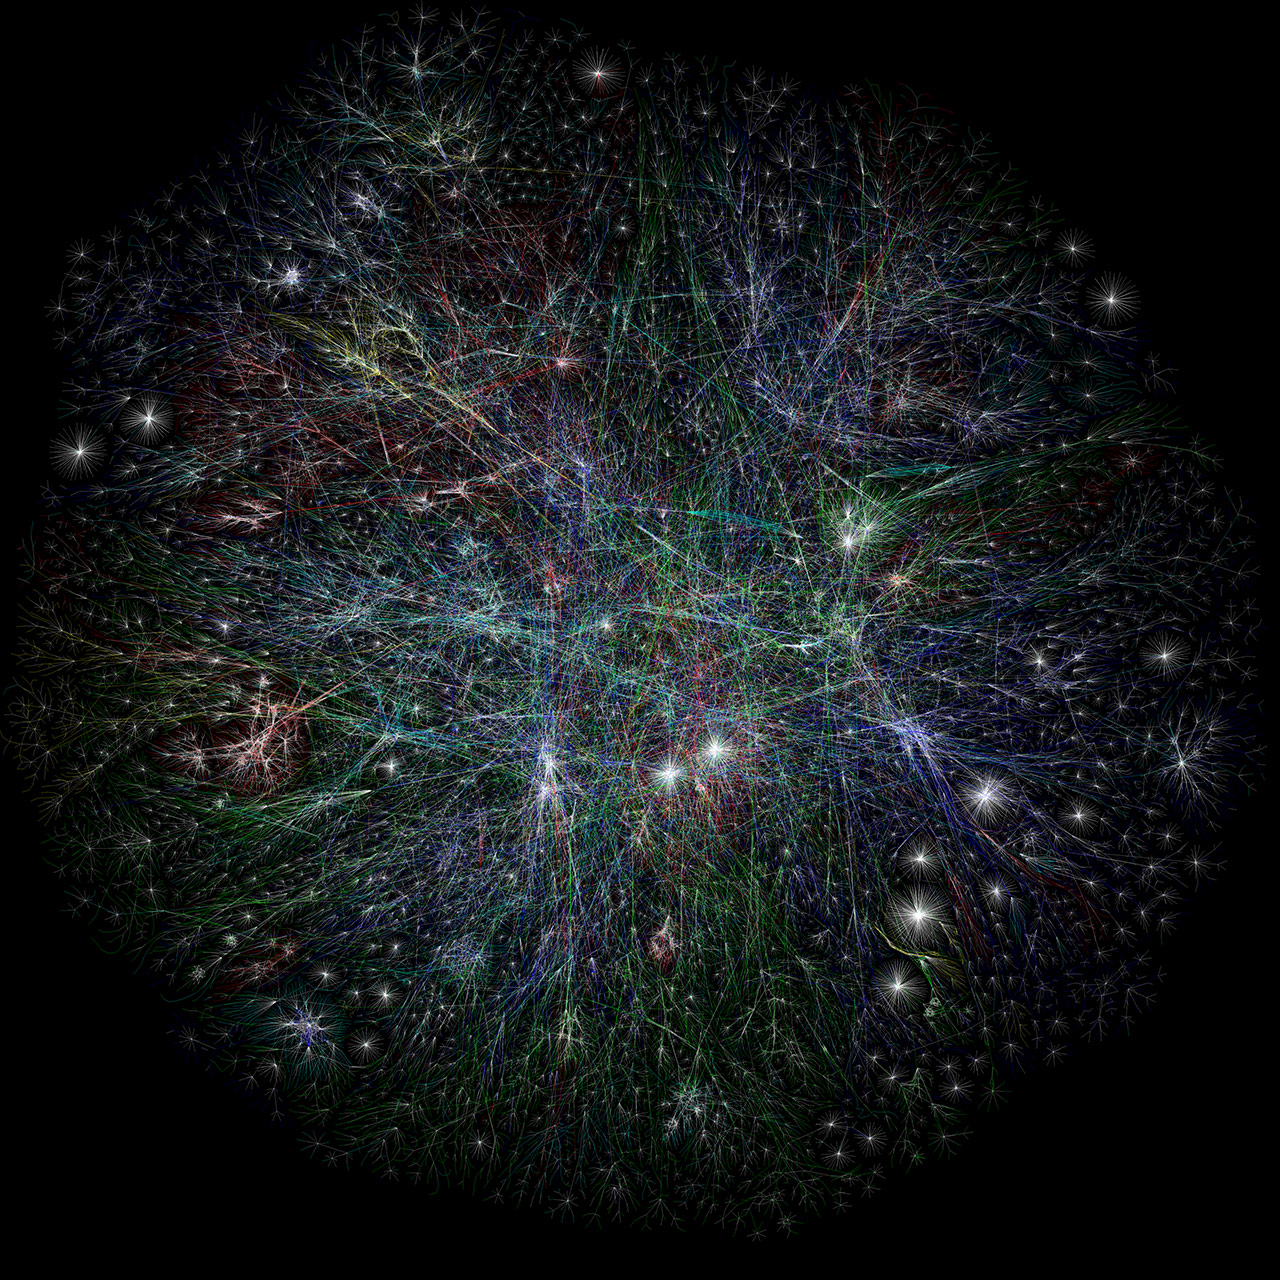
This unusual map was made in 2012. The author analyzed how 350,000 websites relate to each other. Each web-resource has a different color according to its geographical location: for example, blue is for USA and red represents Russia. Every site is presented as a circle on the map, and its size is determined by the website traffic.
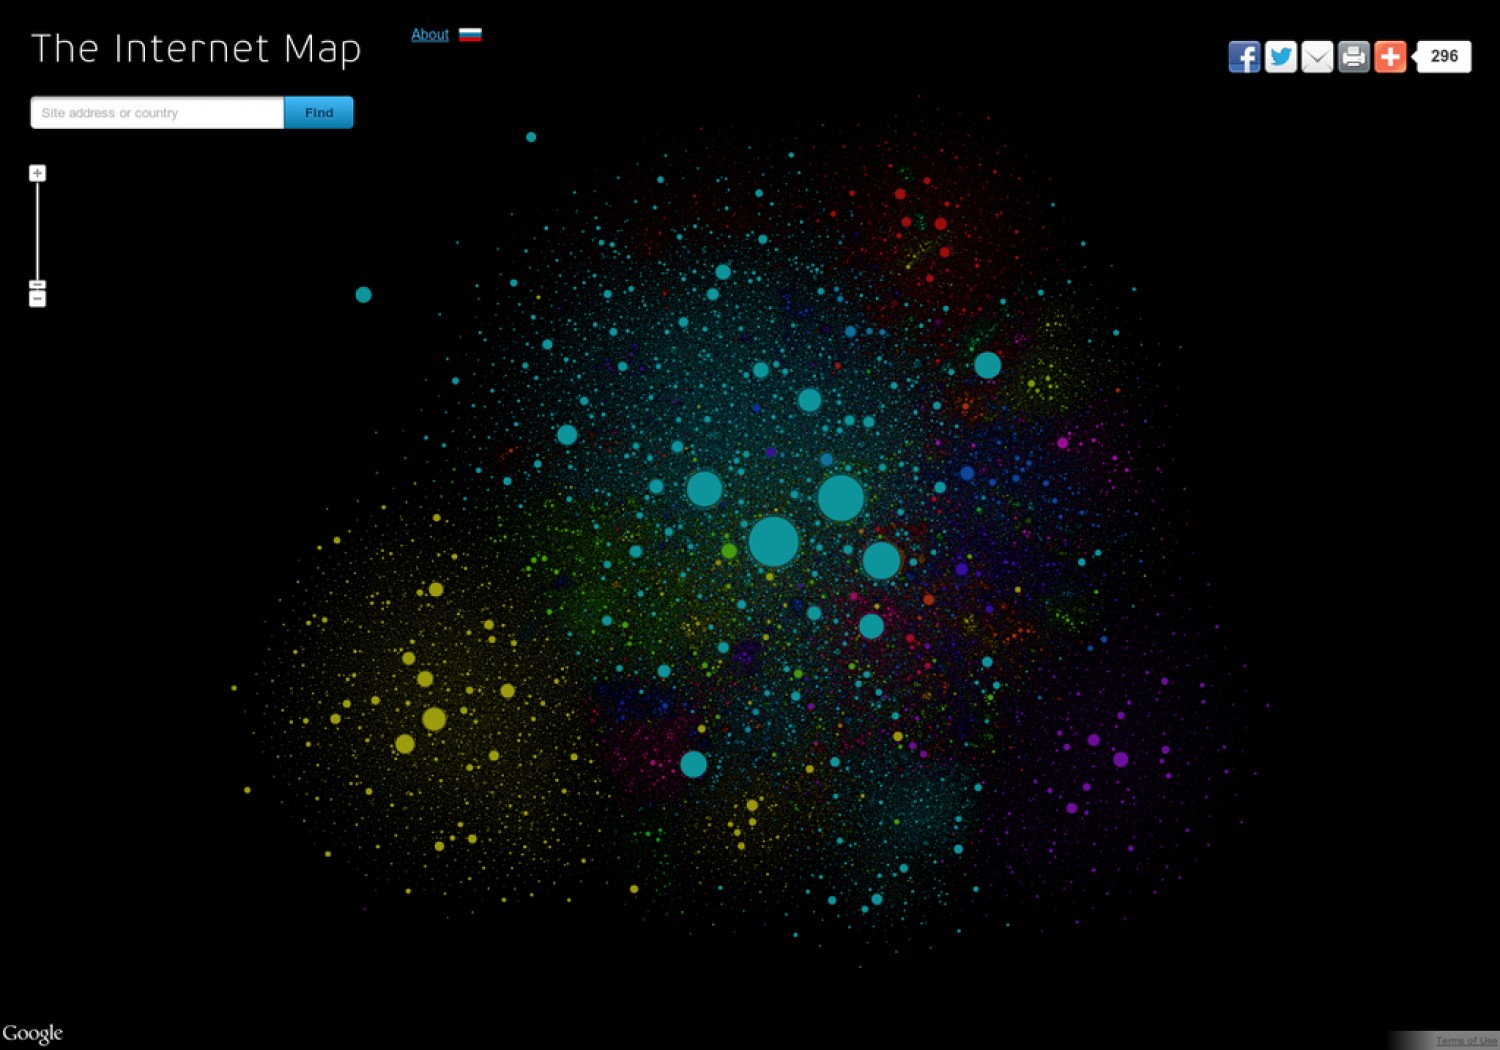
When users switch between websites they form links. The stronger the link, the closer the circles tend to arrange themselves to each other.
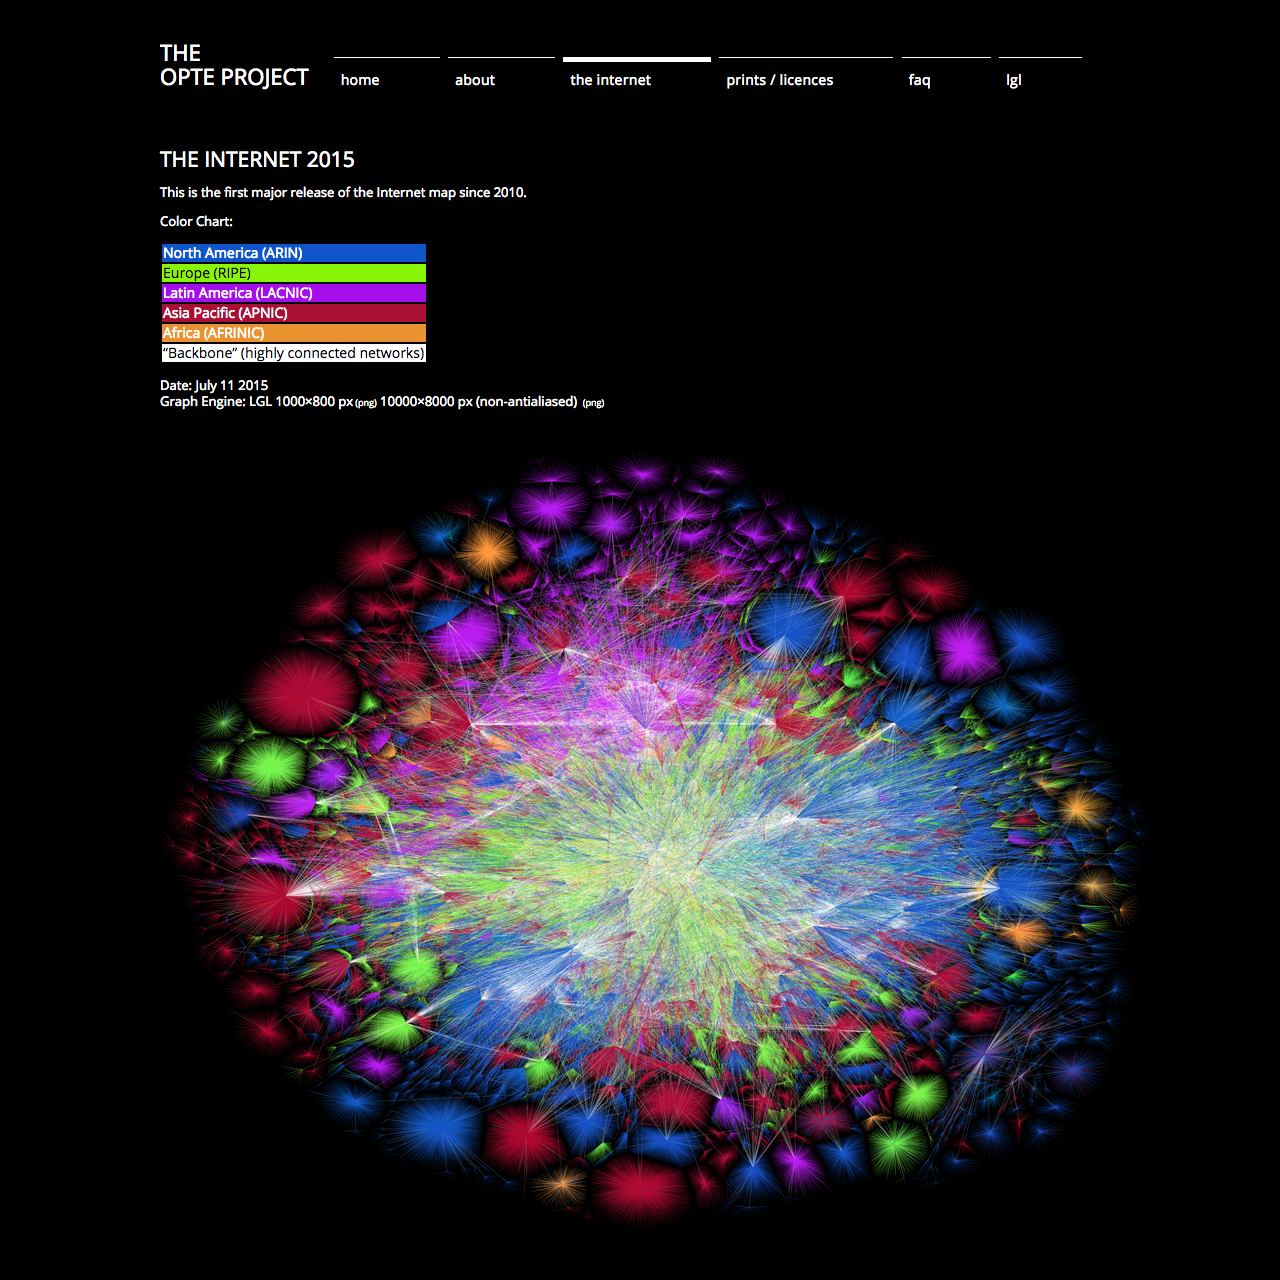
5. Over a distance of ping
An interesting map of the Internet was produced by Barrett Lyon and C in 2003. Since then it was updated twice: in 2010 and 2015.
You can check all three versions of the map at the Barrett’s site. In the beginning of the project author pinged every network, but in 2015 he changed tactics and used Internet’s true routing tables.
6. Illegal Internet census
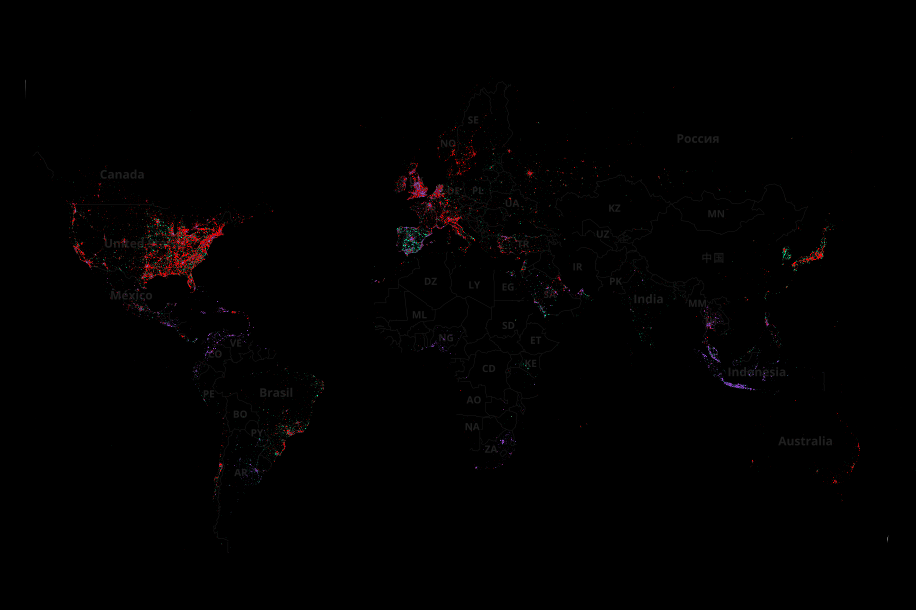
Yes, it’s possible. In 2012 an anonym created a giant network of infected devices called Carna Botnet, which included 420,000 devices with unreliable passwords.
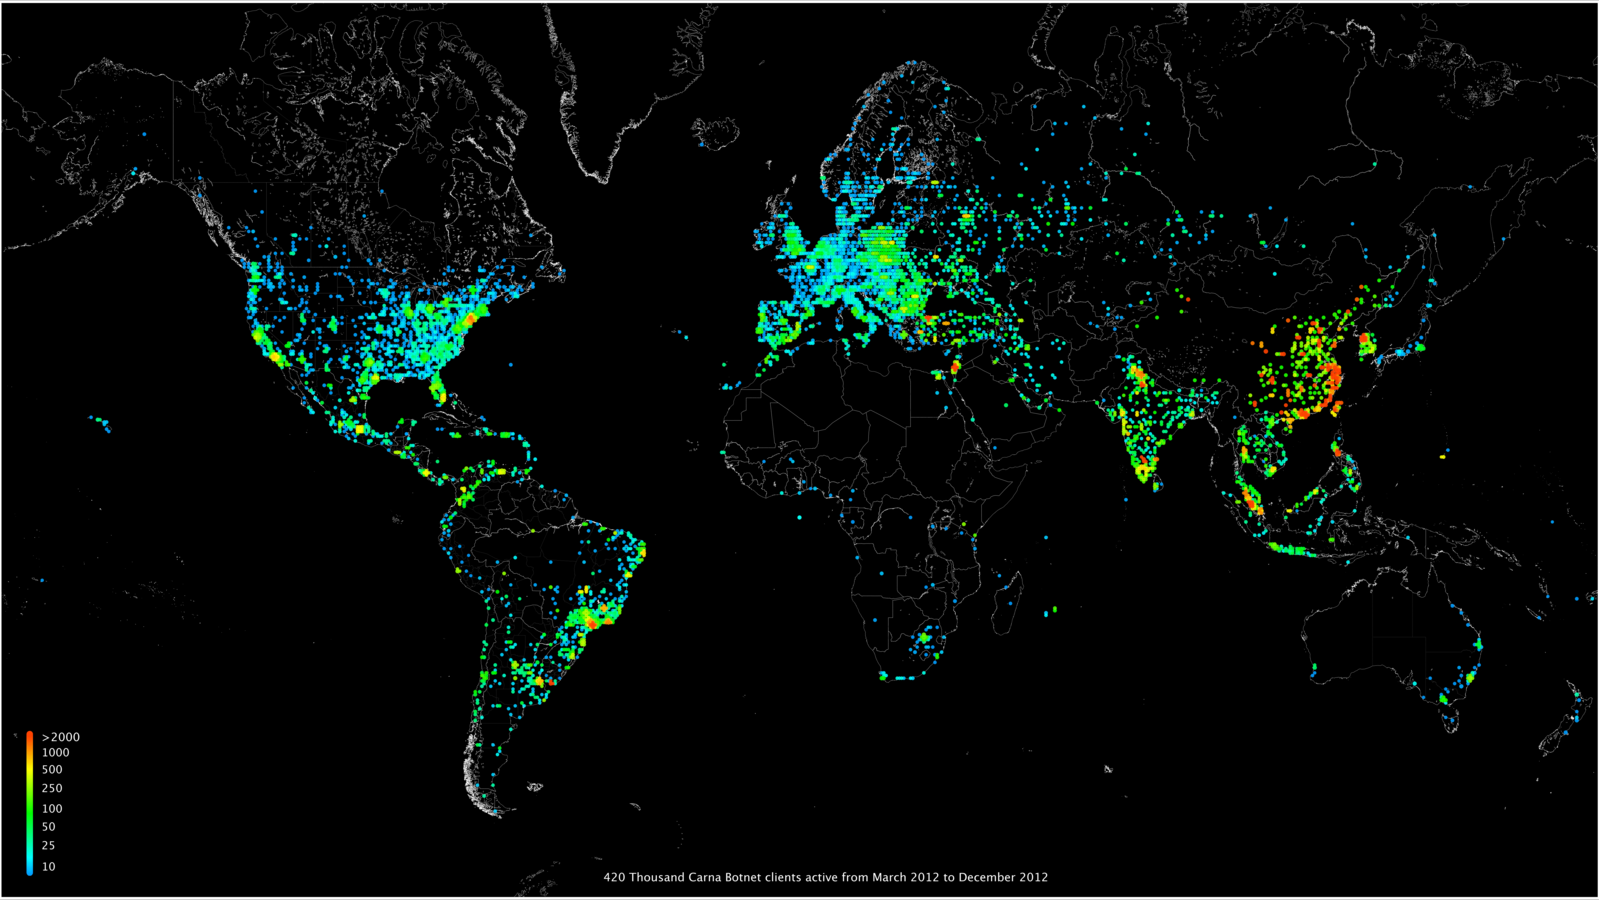
Infected systems were used to ping anything they could reach. In the end the author produced a map, which shows 460 billion devices connected to the Internet.
7. Observe cybercrime in real time
Here in Kaspersky Lab we also like maps. You can use our real-time interactive map to find out, which cyberthreats are registered in different parts of the world right now.
Have you seen our #cybermap yet? https://t.co/yxpi7lciJ1 #realtime map https://t.co/fFBGxWOK6M
— Kaspersky (@kaspersky) July 7, 2015

 Tips
Tips